Quick Graphs: Molecular & Cell Biol Admin

Quick Graphs: Glossary Table
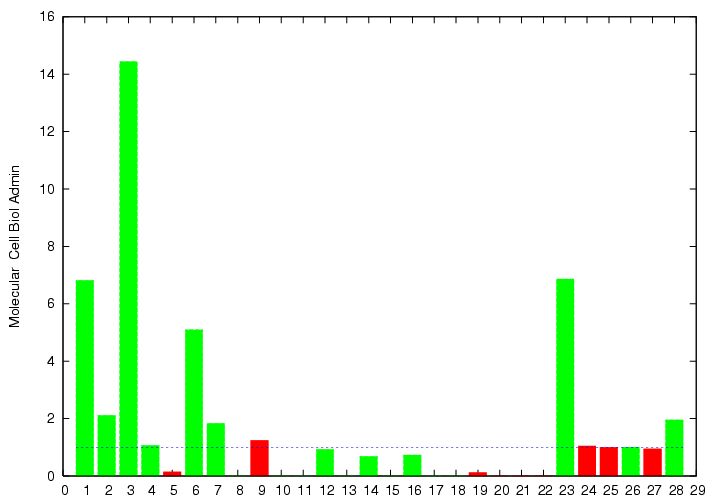
Below is a description of each of the categories used in the Quick Graphs. The numbers in parentheses at the end of each line are the DMI Line Items used to compute that category. Categories 1-7, 19-23, and 25-27 are considered better (green) when above the campus median, while categories 8-18 and 24 are considered better (green) when below the campus median.
- Prop. of All College/School IUs Delivered (6150)
- Prop. of All College/School Undergrad Students (3680)
- Prop. of All College/School Grad Students (3820)
- Relative HS Class Rank (4140)
- Prop. of All College/School Bachelor's Degrees (4490)
- Prop. of All College/School Masters Degrees Produced (4500)
- Prop. of All College/School Ph.D.'s Produced (4510)
- State Dollars per Undergrad Major (3115+3116)/(3110+3111)
- State Dollars per IU (3020)
- Faculty per IU (1320+1400) / 5200
- Acad Pro per Majors = 1440 / 3600
- Acad Pro per IU = 1440 / 5200
- Teach Asst per Major = 1480 / 3600
- Teach Asst per IU = 1480 / 5200
- Clerical Staff per Major = 1540 / 3600
- Clerical Staff per IU = 1540 / 5200
- Space Allocation per Majors = 3410 / 3600
- Space Allocation per IU = 3410 / 5200
- Bachelor's Degrees Per State Dollars 4420 / (2000 * $1000)
- Master's Degrees Per Faculty FTE 4430 / (1320+1400)
- Master's Degrees Per State Dollar 4430 / (2000 * $1000)
- Doctoral Degrees Per Faculty FTE 4460 / (1320+1400)
- Doctoral Degrees Per State Dollar 4460 / (2000 * $1000)
- Average Semesters To Doctoral Degree (4760)
- Prop. of IU's taught by Faculty (6220)
- Prop. of Sections Using ICES (9520)
- Prop. of ICES Evaluations in Top 2 Categories (9780)
- Faculty Contact Hours (6920)

